2016 vs 2015
Gross rental income for FY 2016 was $97.2 million, a decrease of $3.5 million or 3.5% from FY 2015 of $100.7 million.
- At KDC DUB 1, there was lower rental income arising from a client downsizing its requirements in 1Q 2016 as well as the absence of the initial recognition gain recorded in 1Q 2015 for the straight-lining of rental income.
- At Almere DC, there was also a one-off non-cash downward adjustment for the straight-lining of rental income in 3Q 2016.
- There was a drop in the variable income at the Singapore Properties due to lower recurring and power revenue.
- In addition, overseas contribution declined due to the depreciation of AUD, GBP and MYR against SGD.
These were partially offset by contribution from IC2, Cardiff DC and Milan DC. Other income was $2.0 million arising mainly from power revenue charged to clients, as well as the rental top up income provided by the vendor of a newly acquired overseas asset.
For FY 2016, the impact of lower gross revenue was offset by savings in property operating expenses of $8.2 million, a decrease of $7.4 million or 47.4%, as compared to FY 2015.
- This was largely due to a one-off refund of 2015 property tax in 3Q 2016 before the associated consultancy fees paid in relation to the appeal and taxes due to revisions in the annual value of the investment properties in Singapore, as compared to the higher property taxes that were incurred during 2015.
- Lower repairs and maintenance and other property-related costs from the colocation assets also contributed to the lower property expenses.
As a result, net property income of $90.9 million for FY 2016 was $4.0 million or 4.7% higher than FY 2015.
Revenue by the country
Keppel DC REIT own 13 properties around the world, with 3 properties in Singapore still account 41% of the gross revenue.From the below table, we can see, Keppel DC Dublin 1 which now the occupancy rate is at 55.8% the revenue drop by around $4 million.
2016
|
2015
| |||
Revenue in %
|
Revenue in $
|
Revenue in %
|
Revenue in $
| |
Singapore
|
41.53%
|
41,176
|
40.75%
|
41,757
|
Australia
|
28.52%
|
28,272
|
25.92%
|
26,562
|
Ireland
|
11.01%
|
10,915
|
14.11%
|
14,455
|
Other countries
|
18.94%
|
18,776
|
19.21%
|
19,688
|
100.00%
|
99,139
|
100.00%
|
102,462
| |
Debt
Average leverage stood at 28.3% and average interest rate stood at 2.3% with debt tenor average at 3.2 years. 2018 and 2019 debt account 34.9% and 29.6%, for 2018 debt are in GBP, AUD and EUR while 2019 is in SGD.
- Keppel DC REIT has borrowed in the currency where the property located which indirectly give natural hedging.
Lease
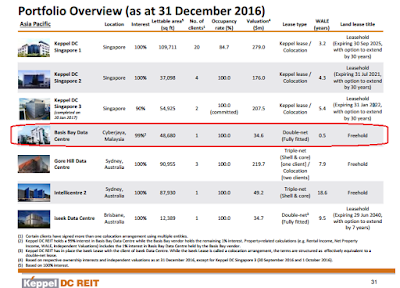
One of the reason why I love Keppel DC REIT on the other side it will be the risk when the master lease expires. I think the risk is partially mitigated as over 40% revenue and whereby long lease are mostly outside Singapore. The nearest master lease to expire will be the Basis Bay Data Centre which may expire in Q2FY17, the next nearest master expiry lease will be in 2025
Dividend
2nd Half dividend impacted due to
- The 242.0 million new Units listed on 15 November 2016, pursuant to the pro-rata preferential offering, are entitled to the distributable income.
- In addition, there was a period of 1.5 months for which there was no income contributed by Keppel DC Singapore 3 as the acquisition was completed later than expected.
Moving forward to FY2017 there will be boost from the below property that was acquired in Q4 2016 to provide full contribution
- Milan Data Centre was completed in 21 Oct 2016
- Cardiff Data Centre was completed in 6 Oct 2016
- Keppel DC Singapore 3 was completed in 20 Jan 2017
2016
|
2015
|
0.0614
|
0.0684
|
The 242.0 million new Units listed on 15 Nov
|


No comments:
Post a Comment