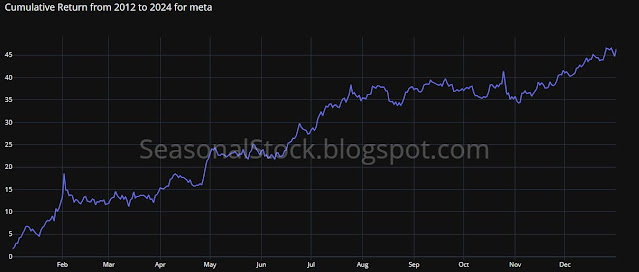
Meta Platforms, Inc. (META) - Seasonal Performance Overview
Meta
Platforms, Inc. (META) exhibits key seasonal trends that can guide
investment strategies. Historically, META tends to be bullish from
mid-January to the end of January (winter), from the end of April to
mid-June (spring), in July (summer), and during November and December
(autumn and winter). These periods often correspond with earnings
reports, product launches, and increased advertising revenue, driving
positive momentum in the stock.
In mid-January to the end of
January, Meta typically sees a bullish phase as it releases
fourth-quarter earnings. Strong financial performance during the holiday
season, along with positive earnings reports and guidance, contributes
to a favorable outlook for the stock.
The period from the end of
April to mid-June marks another strong phase, driven by first-quarter
earnings and updates on user growth and engagement. Strategic
initiatives, such as new product rollouts, also support the stock’s
upward trajectory during this time.
July is another bullish
period for Meta, coinciding with second-quarter earnings and increased
summer activity on social media platforms, which leads to higher
advertising revenues. Meta’s continued innovation further bolsters
investor sentiment.
November and December are particularly
favorable due to the holiday shopping season and increased year-end
advertising spend, driving higher revenue and anticipation of strong
year-end results.
In summary, Meta’s stock tends to perform well
in mid-January (winter), late April to mid-June (spring), July (summer),
and November and December (autumn and winter), reflecting periods of
strong financial performance and increased advertising revenue.
Investors can capitalize on these bullish periods by aligning their
strategies with Meta’s seasonal strengths.
 |
| META Seasonality Chart |


No comments:
Post a Comment