Showing posts with label I. Show all posts

Wednesday, 20 November 2024

IPG Seasonality Chart

Interpublic Group of Companies, Inc. (IPG) - Seasonal Performance Overview


Interpublic Group of Companies, Inc. (IPG) displays notable seasonal trends that can inform investment strategies. Historically, IPG shows bullish tendencies from mid-February to the end of February (winter), late March to the end of April (spring), July (summer), and from mid-November to early December (late autumn to early winter). These periods often coincide with favorable business developments, strategic campaigns, and seasonal upticks in advertising demand.

The mid-February to end-of-February bullish phase typically aligns with the release of strong year-end financial results and the start of new advertising campaigns for the year. This period boosts investor confidence, reflecting positive market sentiment.

Late March to the end of April marks another bullish phase, driven by spring advertising campaigns and preparations for major consumer events. As businesses ramp up marketing efforts for the spring and early summer seasons, IPG benefits from increased client spending, contributing to the stock's positive performance.

July is also a strong month for IPG, as summer campaigns and mid-year financial reports bolster investor optimism. The stock’s performance during this period is often linked to successful advertising initiatives and strategic partnerships.

From mid-November to early December, IPG experiences another bullish period, fueled by holiday season advertising and year-end marketing campaigns. This period typically sees a surge in client activity as companies invest heavily in marketing to capture holiday consumer spending.

On the bearish side, IPG tends to experience pullbacks in March (late winter to early spring), mid-June (early summer), late July (mid-summer), mid-August (late summer), and mid-September (early autumn). These periods may reflect seasonal lulls in advertising demand or market adjustments following strong earlier performance.

In summary, Interpublic Group of Companies, Inc. tends to perform well from mid-February to the end of February, late March to the end of April, July, and from mid-November to early December. However, investors should be cautious of potential bearish pullbacks in March, mid-June, late July, mid-August, and mid-September. 
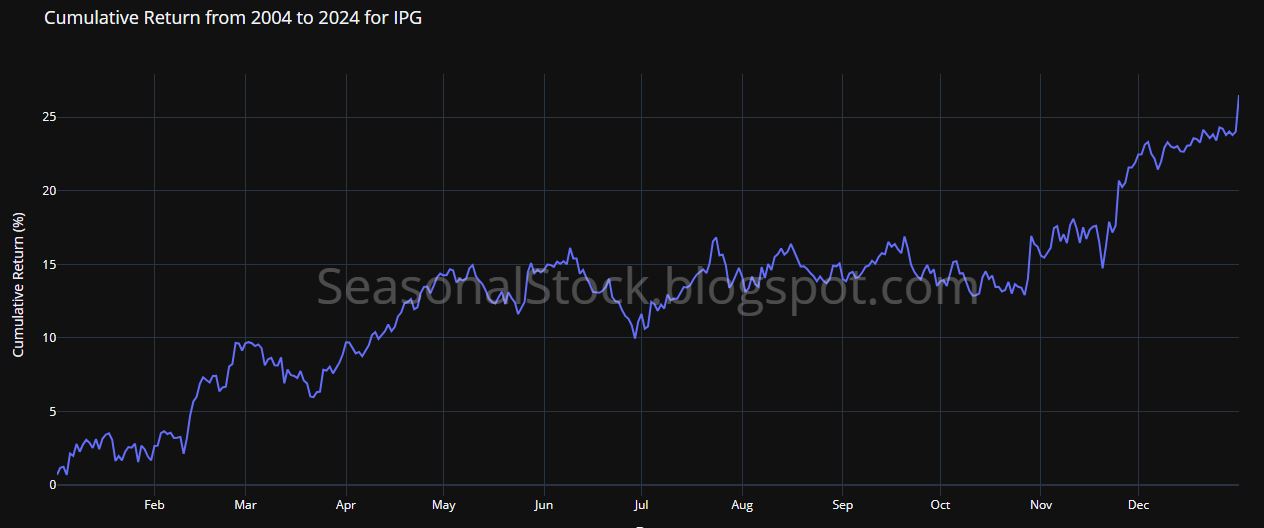

IPG Seasonality Chart


Tuesday, 12 November 2024

IBM Seasonality Chart


International Business Machines Corporation (IBM) - Seasonal Trend Overview


International Business Machines Corporation (IBM) showcases distinct seasonal stock trends that can be valuable for investors aiming to fine-tune their stock strategies. Historically, IBM stocks tend to display a bullish tendency in February, late March, July, and from late October through December. On the flip side, bearish trends are commonly observed in mid-April, mid-June, and mid-October.

The bullish period in February often coincides with the transition from winter to early spring, a time when investor optimism begins to rise after the new year. This period frequently sees stronger performance in IBM stocks, with increased market activity driving positive momentum.

Late March, during the middle of spring, marks another favorable time for IBM stocks. This is typically a period of economic growth, where corporate earnings expectations rise, contributing to a steady bullish trend. July, situated in the heart of summer, also tends to bring favorable market conditions for IBM, supported by ongoing mid-year business evaluations and strong investor sentiment.

From late October to December, as autumn transitions into winter, IBM stocks generally enter another bullish phase. This period aligns with end-of-year market dynamics, including increased trading volumes and strategic portfolio adjustments, which help push IBM stocks higher during the close of the calendar year.

On the bearish side, mid-April, at the peak of spring, can present challenges for IBM stocks. This is a time when market volatility may rise, and investors often reassess their portfolios, leading to weaker stock performance. Similarly, mid-June, early in the summer season, is another period where IBM stocks might face bearish pressure, possibly due to reduced trading activity and summer market slowdowns. Lastly, mid-October, as fall progresses, represents a potential bearish phase where caution prevails among investors as they prepare for the year-end.

In summary, IBM stocks show strong bullish tendencies in February, late March, July, and from late October through December, capitalizing on seasonal shifts and investor enthusiasm. However, investors should be aware of bearish trends in mid-April, mid-June, and mid-October, as these periods tend to bring challenges to IBM's stock performance.

IBM Seasonality Chart


Friday, 18 October 2024

Incyte Corporation (INCY): Seasonal Chart


INCY's seasonal data indicates potential bullish patterns from August 12th to 21st

INCY Seasonality Chart

Popular Posts

Blog Posting