Monday, 2 December 2024

CTVA Seasonality Chart

Corteva, Inc. (CTVA)  - Seasonal Performance Overview

Corteva, Inc. (CTVA) demonstrates clear seasonal trends that can be useful for investment planning. Historically, CTVA shows bullish tendencies at the end of January through mid-February, mid-March, early April, mid-May, mid-July, the beginning of October, and December. These periods often reflect key agricultural cycles, market demand shifts, and strategic developments in the company’s operations.

The bullish phase from late January to mid-February typically benefits from the post-harvest period and the anticipation of spring planting. As farmers plan for the growing season, CTVA often sees increased demand for its products, driving positive stock performance.

Mid-March and early April represent favorable periods, often coinciding with the start of the planting season and associated agricultural activities that boost the company's performance. This is followed by another bullish phase in mid-May, aligning with the planting season’s progress and growing investor optimism.

Mid-July marks another strong period, influenced by mid-year agricultural reports and the initial impact of growing season results. The beginning of October sees renewed interest as harvest approaches and farmers plan for the upcoming year, driving stock performance.

December is another bullish period, generally supported by year-end financial results and strategic initiatives, as well as preparations for the next growing season.

On the bearish side, CTVA tends to experience weaker performance from mid-January, mid-February to mid-March, early June, early July, and mid-September. These downturns may result from seasonal adjustments in the agricultural sector, market corrections, or strategic pauses.

In summary, Corteva, Inc. generally performs well from late January to mid-February, mid-March, early April, mid-May, mid-July, early October, and December. However, investors should be aware of potential bearish trends in mid-January, mid-February to mid-March, early June, early July, and mid-September.

CTVA Seasonality Chart


Sunday, 1 December 2024

XLC Seasonality Chart

XLC - Seasonal Performance Overview


The Communication Services Select Sector SPDR Fund (XLC) exhibits distinct seasonal patterns that investors can leverage for strategic planning. Historically, XLC tends to show strong upward momentum in January, from mid-March to mid-April, and from mid-June to mid-July. These periods often coincide with significant industry developments, quarterly earnings reports, and broader market trends that favor the communication services sector.

The bullish trend in January can be attributed to the new fiscal year's start, where companies in the communication sector often announce strategic initiatives and guidance that boost investor confidence. This period may also benefit from market optimism as investors recalibrate their portfolios for the year ahead.

The phase from mid-March to mid-April typically aligns with the end of the first quarter, a time when companies report earnings and provide updates on their yearly outlooks. Positive earnings surprises and strong performance within the sector can drive XLC’s stock prices higher during this time.

Similarly, mid-June to mid-July is another strong period for XLC, often driven by mid-year reviews and continued momentum from second-quarter performance. Companies may also release mid-year guidance and updates that could influence stock prices positively.

On the bearish side, XLC tends to experience weaker performance in February and September. The February downturn could be related to market corrections following January's optimistic start, as well as the adjustment period after earnings season. September is traditionally a challenging month for the stock market, and XLC is not immune to broader market sell-offs or sector-specific concerns during this time.

In summary, XLC generally performs well in January, mid-March to mid-April, and mid-June to mid-July. However, investors should be cautious of potential bearish trends in February and September, which could present challenges for the sector.


XLC Seasonality Chart


Saturday, 30 November 2024

CCL Seasonality Chart

Carnival Corporation & plc (CCL) - Seasonal Trend Overview


Carnival Corporation & plc (CCL) shows distinct seasonal trends that are important for developing effective stock strategies. Historically, CCL stocks exhibit a bullish tendency at the end of May, from mid-August to mid-September, and from mid-October to the end of December, while experiencing bearish periods in mid-January, mid-February, mid-June, and mid-September.

The bullish phase at the end of May, as spring turns into summer, often coincides with a rise in cruise bookings and travel interest. This period typically sees a surge in consumer spending on vacations, which translates into positive momentum for CCL's stocks. Investors often capitalize on this trend, contributing to a steady increase in stock performance as summer approaches.

Mid-August to mid-September, during the late summer season, represents another strong period for CCL. As families take advantage of late-summer vacations and the cruise industry hits its peak season, there’s a noticeable boost in bookings, leading to bullish trends for CCL stocks. This seasonal uptick makes CCL an attractive investment for those looking to benefit from the travel industry’s strength during this period.

From mid-October to the end of December, as fall transitions into winter, CCL experiences a significant bullish phase. The year-end holiday season often drives an increase in cruise bookings for winter getaways and holiday travel, which enhances investor confidence and fuels a rally in CCL's stock performance. This period is especially beneficial for CCL stocks as travel enthusiasts and holiday planners seek out cruise options.

On the bearish side, mid-January, as winter sets in, tends to be a challenging period for CCL. The post-holiday slump often results in a decrease in travel activity, leading to weaker demand for cruises, which negatively impacts CCL's stocks.

Mid-February, still within the winter season, can also be bearish for CCL. This period tends to experience slower booking activity, which can lead to a dip in investor interest and a subsequent decline in stock performance.

Mid-June, in the midst of summer, represents another bearish phase. Despite being part of the summer season, mid-June often sees a temporary lull in bookings, which can cause a slowdown in CCL’s stock performance.

Lastly, mid-September, as summer transitions into fall, is another bearish period for CCL. Market adjustments and a slight decrease in travel enthusiasm can contribute to a dip in CCL's stocks during this time.

In summary, Carnival Corporation & plc tends to show strong stock performance at the end of May, from mid-August to mid-September, and from mid-October to the end of December. However, investors should be mindful of potential bearish trends in mid-January, mid-February, mid-June, and mid-September, which could impact CCL's stock performance during these periods.

CCL Seasonality Chart


Friday, 29 November 2024

TPX Seasonality Chart

Tempur Sealy International, Inc. (TPX) - Seasonal Performance Overview


Tempur Sealy International, Inc. (TPX) demonstrates notable seasonal patterns that can inform investment strategies. Historically, TPX tends to show strong upward momentum in July, early September, and from November to December. These periods often align with key retail cycles, promotional events, and consumer spending trends that positively impact the company's stock performance.

The bullish trend in July can be attributed to the mid-year retail season, where summer sales and promotional campaigns drive increased demand for Tempur Sealy’s products. This period often benefits from consumer spending on home improvements and back-to-school preparations, boosting TPX’s stock performance as sales figures improve.

Early September marks another favorable period for TPX, likely influenced by the tail end of summer sales and the start of fall promotional activities. This phase often coincides with renewed consumer interest in home furnishings, particularly as the back-to-school season transitions into preparations for the holiday season.

November and December are historically strong months for TPX, driven by the holiday shopping season. The company typically sees a surge in sales during this time as consumers take advantage of Black Friday, Cyber Monday, and other holiday promotions to purchase mattresses and bedding products. Year-end bonuses and holiday spending further bolster this bullish period, leading to positive stock performance.

On the bearish side, TPX tends to experience weaker performance from mid-September to mid-October. This downturn may result from seasonal market adjustments following the back-to-school rush and a temporary lull before the holiday shopping season begins in earnest. During this period, investors might also exercise caution as they await third-quarter earnings reports, which can influence market sentiment.

In summary, Tempur Sealy International, Inc. generally performs well in July, early September, and from November to December. However, investors should be cautious of potential bearish trends from mid-September to mid-October, which could present challenges for the stock's performance.


TPX Seasonality Chart


Thursday, 28 November 2024

SIRI Seasonality Chart

Sirius XM Holdings Inc. (SIRI) - Seasonal Trend Overview


Sirius XM Holdings Inc. (SIRI) exhibits clear seasonal trends that are vital for formulating stock strategies. Historically, SIRI stocks demonstrate a bullish tendency in mid-February, late June, and November, while showing bearish tendencies in mid-July and mid-September.

The bullish phase in mid-February, as winter transitions to spring, often coincides with a period of increased market activity. This seasonal shift tends to boost consumer interest in entertainment services, leading to a positive trend in SIRI's stock performance. Investors frequently leverage this pattern, resulting in a rise in SIRI's stocks during this late winter to early spring phase.

Late June, during the peak of summer, is another period of strength for SIRI. As more people engage in summer travel and outdoor activities, demand for satellite radio and entertainment services tends to rise, contributing to bullish trends for SIRI's stocks. This seasonal uptick makes SIRI an appealing option for investors looking to capitalize on summertime demand.

November, as fall transitions into winter, represents another significant bullish phase for SIRI. The end-of-year holiday season typically brings an increase in subscriptions and promotional activities, leading to heightened investor interest and driving up the performance of SIRI's stocks.

On the bearish side, mid-July, in the heart of summer, tends to be a challenging period for SIRI. Market activity often slows down during this time, leading to a temporary decline in stock performance. Investors may see reduced interest in SIRI's stocks during this lull, resulting in bearish pressure.

Mid-September, as summer gives way to fall, is another bearish phase for SIRI. The transition period often involves market adjustments and a potential dip in consumer spending, which can impact SIRI's stock negatively.

In summary, Sirius XM Holdings Inc. generally experiences bullish stock performance in mid-February, late June, and November. However, investors should be cautious of potential bearish trends in mid-July and mid-September, which could affect SIRI's stock performance during these transitional periods.

SIRI Seasonality Chart


Wednesday, 27 November 2024

AXTA Seasonality Trend

Axalta Coating Systems Ltd. (AXTA) - Seasonal Trend Overview


Axalta Coating Systems Ltd. (AXTA) shows clear seasonal trends that provide insights for stock investment strategies. Historically, AXTA's stocks exhibit bullish tendencies during April, from late May to early June, and in November. Conversely, March and parts of November tend to be bearish periods.

The bullish phase in April, as winter transitions into spring, aligns with renewed market optimism. Investors often become more active during this period, driving positive stock performance for AXTA. Late May to early June, during late spring, also sees a rise in stock momentum, possibly due to stronger industrial demand heading into summer months.

November, marking the transition from fall to winter, is another strong period for AXTA stocks. The end-of-year market dynamics and increased demand for industrial coatings contribute to robust stock performance during this time.

On the bearish side, March, as winter fades into spring, tends to bring challenges for AXTA. This period often involves cautious investor behavior, leading to weaker stock performance. Similarly, part of November also exhibits bearish tendencies, as the market may face brief corrections or adjustments before the holiday season.

In summary, Axalta Coating Systems Ltd. generally experiences bullish trends in April, from late May to early June, and in November, with strong seasonal factors boosting stock performance. However, investors should be cautious during March and parts of November, as these periods may bring bearish trends that could impact AXTA's stock performance.

AXTA Seasonality Trend


Tuesday, 26 November 2024

VRNS Seasonality Chart

Varonis Systems, Inc. (VRNS) - Seasonal Performance Overview


Varonis Systems, Inc. (VRNS) exhibits clear seasonal trends that investors can utilize for informed decision-making. Historically, VRNS shows strong upward movement from the end of January to mid-February, mid-May to the end of June, throughout August, and in November and December. These periods often align with significant product launches, cybersecurity industry developments, and fiscal year-end activities that support positive stock performance.

The bullish phase from the end of January to mid-February typically benefits from the cybersecurity sector's post-holiday period, where companies reassess and invest in data protection solutions for the new year. VRNS often sees increased demand for its products, driving positive stock performance as businesses prioritize security upgrades.

Mid-May to the end of June represents another favorable period, often coinciding with second-quarter earnings reports and strategic updates from the company. This phase may also be driven by the broader market's mid-year evaluations, where positive sentiment towards tech stocks can boost VRNS.

August is another strong month for VRNS, potentially due to mid-year corporate budget allocations and increased investments in cybersecurity as companies prepare for the second half of the year. This period often sees heightened awareness of data breaches, leading to increased demand for Varonis' solutions.

November and December are also bullish periods, typically supported by year-end financial results, holiday season spending, and preparations for the upcoming fiscal year. During these months, companies often finalize their budgets, leading to a surge in demand for VRNS’s offerings as they secure their systems for the year ahead.

On the bearish side, VRNS tends to experience weaker performance in early May and September. The early May downturn could be related to market adjustments following strong April performance, as well as cautious sentiment ahead of the company’s earnings reports. September is traditionally a volatile month for the market, and VRNS may face challenges from broader tech sector sell-offs or shifts in investor sentiment.

In summary, Varonis Systems, Inc. generally performs well from the end of January to mid-February, mid-May to the end of June, in August, and during November and December. However, investors should be mindful of potential bearish trends in early May and September, which could impact the stock's performance.


VRNS Seasonality Chart


Monday, 25 November 2024

NTRA Seasonality Trend

Natera, Inc. (NTRA) - Seasonal Trend Overview


Natera, Inc. (NTRA) displays notable seasonal trends that can help investors refine their stock strategies. Historically, NTRA's stocks show a bullish tendency during the spring months of May and June, as well as in August, while experiencing bearish phases from September to October.

The bullish phase in May and June coincides with the transition from spring to summer. As warmer weather arrives, market activity typically picks up, fueled by optimism and increased investor engagement. This period often witnesses a rise in NTRA's stocks, driven by positive developments and strong market sentiment as companies report their quarterly earnings.

August, as summer wanes, also represents a strong month for NTRA. Investors often reposition their portfolios ahead of the fall, leading to heightened trading volumes and favorable performance for NTRA's stocks. This seasonal uptick reflects a renewed interest in the biotech sector, particularly as new products and innovations gain traction.

Conversely, the bearish period from September to October marks a shift as summer transitions into fall. This time frame often brings increased volatility as investors reassess their strategies and market conditions shift. The end of the summer lull can lead to a decline in NTRA's stocks as market participants react to potential uncertainties and adjustments in economic forecasts.

In summary, Natera, Inc. generally performs well from May to June and in August, driven by increased investor activity and positive market sentiment. However, investors should be cautious of potential bearish trends from September to October, as these months can lead to fluctuations in NTRA's stock performance amidst broader market adjustments. By understanding these seasonal patterns, investors can better navigate the dynamics affecting NTRA's stocks throughout the year.

NTRA Seasonality Trend


Saturday, 23 November 2024

CELH Seasonality Chart

Celsius Holdings, Inc. (CELH) - Seasonal Performance Overview


Celsius Holdings, Inc. (CELH) typically experiences a strong bullish phase from mid-January through July, driven by increased consumer interest in health and fitness during the early and mid-year months. This period often sees a surge in demand for Celsius products, leading to positive stock performance.

After July, CELH generally enters a sideways trading phase for the remainder of the year. Notably, the stock tends to pull back from September to mid-October, likely due to seasonal slowdowns. However, it usually rebounds from mid-October to the end of October as investors anticipate year-end activity.

In summary, CELH shows strong performance from mid-January to July, with a pullback in September to mid-October, followed by a brief recovery through October's end.ommunications, Inc. (CHTR) displays distinct seasonal patterns that can provide valuable insights for investors. Historically, CHTR has shown bullish tendencies from the end of June through July (summer), a brief rally at the end of October (autumn), and another upward trend in mid-December (early winter). These periods often align with strategic business initiatives, consumer behavior, and favorable financial reporting.

The bullish phase from the end of June to July typically coincides with summer demand for media and communication services, as consumers spend more time indoors and on entertainment. This period often sees increased subscriptions and higher customer engagement, driving positive stock performance.


CELH Seasonality Chart


Friday, 22 November 2024

CHTR Seasonality Chart

Charter Communications, Inc. (CHTR) - Seasonal Performance Overview


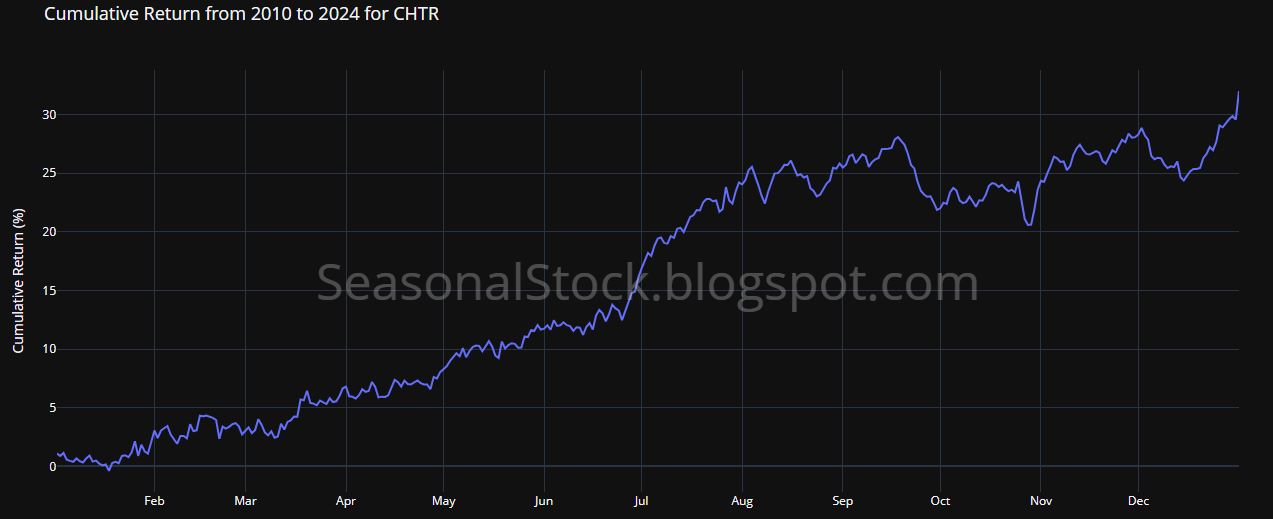
Charter Communications, Inc. (CHTR) displays distinct seasonal patterns that can provide valuable insights for investors. Historically, CHTR has shown bullish tendencies from the end of June through July (summer), a brief rally at the end of October (autumn), and another upward trend in mid-December (early winter). These periods often align with strategic business initiatives, consumer behavior, and favorable financial reporting.

The bullish phase from the end of June to July typically coincides with summer demand for media and communication services, as consumers spend more time indoors and on entertainment. This period often sees increased subscriptions and higher customer engagement, driving positive stock performance.

At the end of October, CHTR experiences a short but noticeable run-up, likely fueled by third-quarter earnings reports and strategic moves in anticipation of the year-end. This autumn rally is generally brief but can be significant, reflecting investor optimism ahead of the holiday season.

Mid-December marks another bullish phase as CHTR benefits from year-end promotions and holiday-driven demand for its services. The company’s efforts to attract new customers and retain existing ones during the holiday season often lead to a positive impact on its stock.

On the bearish side, CHTR tends to experience pullbacks in mid-September (late summer) and early December (late autumn). The mid-September decline might be attributed to market adjustments following the summer rally, while the early December dip could reflect a temporary slowdown before the year-end surge.

In summary, Charter Communications, Inc. generally performs well from the end of June through July, at the end of October, and in mid-December. However, investors should be aware of potential bearish trends in mid-September and early December.

CHTR Seasonality Chart


Thursday, 21 November 2024

CHD Seasoanlity Chart

Church & Dwight Co., Inc. (CHD) - Seasonal Performance Overview


Church & Dwight Co., Inc. (CHD) exhibits distinct seasonal trends that can guide investment strategies. Historically, CHD shows bullish tendencies from January through the end of March (winter to early spring) and again in November (late autumn). These periods are often characterized by strong consumer demand for the company’s products, which include household and personal care items, as well as favorable financial results.

The bullish phase from January to March is typically driven by post-holiday consumer spending and the company’s strategic initiatives to kick off the new year. During this time, CHD often benefits from heightened demand for its broad range of products, which can lead to increased sales and positive investor sentiment.

November represents another strong period for CHD, aligning with the start of the holiday shopping season and year-end stockpiling by consumers. This late autumn rally is frequently supported by solid earnings reports and optimistic projections for the upcoming holiday season, further boosting investor confidence.

On the bearish side, CHD tends to experience a downturn from September to mid-October (late summer to early autumn). This period may reflect a typical slowdown in consumer spending following the summer months and before the holiday season ramps up. The market often sees this as a time of consolidation or correction, leading to weaker stock performance.

In summary, Church & Dwight Co., Inc. tends to perform well from January to the end of March and in November, while investors should be mindful of potential bearish pullbacks from September to mid-October.

CHD Seasoanlity Chart


Wednesday, 20 November 2024

IPG Seasonality Chart

Interpublic Group of Companies, Inc. (IPG) - Seasonal Performance Overview


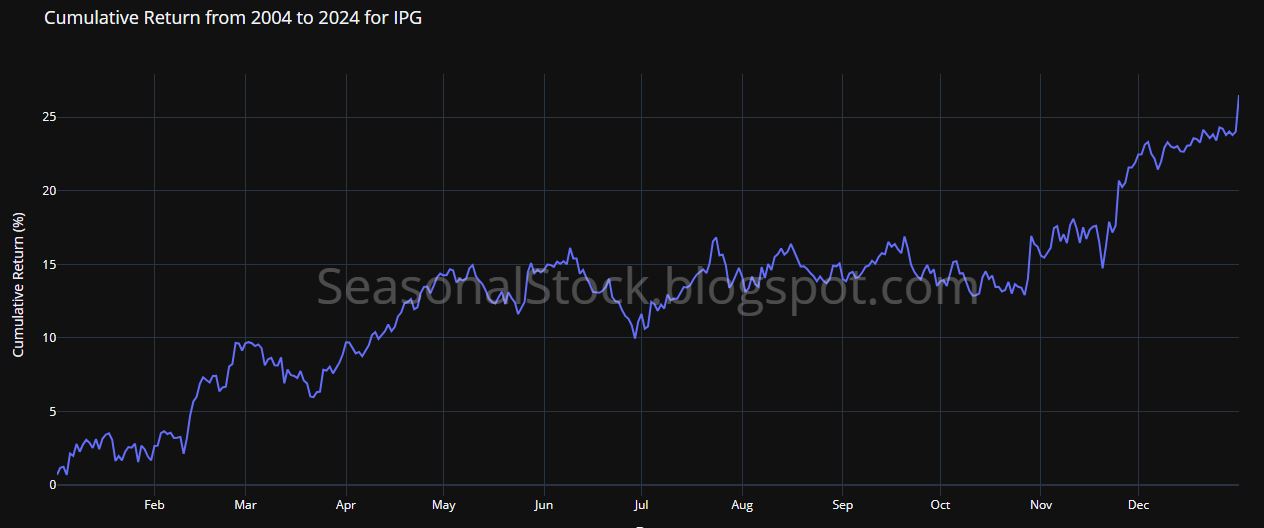
Interpublic Group of Companies, Inc. (IPG) displays notable seasonal trends that can inform investment strategies. Historically, IPG shows bullish tendencies from mid-February to the end of February (winter), late March to the end of April (spring), July (summer), and from mid-November to early December (late autumn to early winter). These periods often coincide with favorable business developments, strategic campaigns, and seasonal upticks in advertising demand.

The mid-February to end-of-February bullish phase typically aligns with the release of strong year-end financial results and the start of new advertising campaigns for the year. This period boosts investor confidence, reflecting positive market sentiment.

Late March to the end of April marks another bullish phase, driven by spring advertising campaigns and preparations for major consumer events. As businesses ramp up marketing efforts for the spring and early summer seasons, IPG benefits from increased client spending, contributing to the stock's positive performance.

July is also a strong month for IPG, as summer campaigns and mid-year financial reports bolster investor optimism. The stock’s performance during this period is often linked to successful advertising initiatives and strategic partnerships.

From mid-November to early December, IPG experiences another bullish period, fueled by holiday season advertising and year-end marketing campaigns. This period typically sees a surge in client activity as companies invest heavily in marketing to capture holiday consumer spending.

On the bearish side, IPG tends to experience pullbacks in March (late winter to early spring), mid-June (early summer), late July (mid-summer), mid-August (late summer), and mid-September (early autumn). These periods may reflect seasonal lulls in advertising demand or market adjustments following strong earlier performance.

In summary, Interpublic Group of Companies, Inc. tends to perform well from mid-February to the end of February, late March to the end of April, July, and from mid-November to early December. However, investors should be cautious of potential bearish pullbacks in March, mid-June, late July, mid-August, and mid-September. 


IPG Seasonality Chart


Tuesday, 19 November 2024

VNO Seasonality Trend

Vornado Realty Trust (VNO) - Seasonal Trend Overview


Vornado Realty Trust (VNO) exhibits distinct seasonal trends that can provide valuable insights for investors looking to optimize their strategies. Historically, VNO has shown strong bullish tendencies from mid-March to April, in July, mid-August, and mid-November, while experiencing bearish trends in February, May, and mid-September.

The bullish phase from mid-March to April, which occurs during the transition from winter to spring, typically aligns with a period of renewed real estate activity as the weather improves. During this time, there is often an increase in leasing and development projects as companies and individuals prepare for the warmer months ahead. The favorable spring weather, coupled with a general uptick in market sentiment, often contributes to positive momentum in VNO's stock performance.

July, firmly within the summer season, represents another significant period of bullish activity for VNO. As the real estate market heats up during the peak summer months, VNO typically benefits from increased demand for commercial properties and office spaces. This seasonal surge in activity, driven by favorable market conditions and heightened business activity, generally leads to a substantial boost in VNO's stock performance.

Mid-August, still within the summer season, often sees continued strength in VNO’s stock as the real estate market remains active before the fall slowdown. This period of sustained demand for commercial real estate, combined with strong market conditions, typically supports a bullish trend for VNO.

Mid-November, during the late fall season, marks the beginning of preparations for the end of the fiscal year, which can drive increased leasing activity and last-minute real estate transactions. This period, coupled with the anticipation of holiday season spending, often results in a positive performance for VNO's stock.

On the bearish side, VNO tends to underperform in February, during the late winter season. This period often coincides with a slowdown in real estate activity as the market waits for the spring thaw. May, as spring transitions to summer, can also be challenging for VNO, as companies may delay decisions until after the summer holidays, leading to a temporary dip in real estate activity and stock performance.

Mid-September, during the late summer to early fall transition, often sees a slowdown in the real estate market as businesses recalibrate for the end of the year. This period of reduced activity, combined with potential market volatility, can lead to a bearish trend in VNO's stock.

In summary, Vornado Realty Trust generally performs well from mid-March to April, in July, mid-August, and mid-November. However, investors should be aware of potential bearish trends in February, May, and mid-September, which could present challenges to the stock's performance.


VNO Seasonality Chart


Monday, 18 November 2024

VKTX Seasonality Trend

Viking Therapeutics, Inc. (VKTX) - Seasonal Trend Overview


Viking Therapeutics, Inc. (VKTX) displays notable seasonal trends that can help investors make informed decisions. Historically, VKTX has exhibited strong bullish tendencies in February and mid-December, while showing bearish trends in mid-January and March.

The bullish phase in February, which occurs in the late winter season, often aligns with renewed investor interest as the year progresses and anticipation builds for upcoming clinical trial results or regulatory updates. This period typically sees a surge in VKTX’s stock as positive sentiment grows, fueled by expectations of progress in the company’s pipeline of drug candidates. The transition from winter to early spring can also bring about increased market optimism, which further supports VKTX’s performance.

Mid-December, marking the onset of winter, represents another significant bullish period for VKTX. During this time, the stock often benefits from end-of-year positioning by investors who are optimistic about upcoming milestones or potential announcements in the new year. The festive atmosphere and the closing of the fiscal year may also contribute to heightened market activity, driving positive momentum in VKTX's stock.

On the bearish side, VKTX tends to underperform in mid-January, coinciding with the post-holiday season in winter. This period often sees a lull in market activity as investors reassess their portfolios after the new year, leading to a temporary dip in VKTX’s stock. Additionally, March, during the transition from winter to spring, can be challenging for VKTX. This month often brings increased market volatility as investors react to broader economic indicators or shifts in market sentiment, which can negatively impact the stock’s performance.

In summary, Viking Therapeutics, Inc. generally performs well in February and mid-December. However, investors should be cautious of potential bearish trends in mid-January and March, which could present challenges to the stock's performance.


VKTX Seasonality Chart


Sunday, 17 November 2024

SR (Spire Inc) Seasonality Chart

 Spire Inc. (SR) - Seasonal Performance Overview


Spire Inc. (SR) exhibits distinctive seasonal trends that can provide insights for investment strategies. Historically, SR shows a bullish tendency from late March to mid-April (spring), mid-May to the end of May (late spring), and a particularly strong bullish phase from mid-October to the end of November (autumn). These periods often align with favorable financial reports and strategic developments within the company.

The late March to mid-April bullish phase is typically driven by positive early spring performance, where the company benefits from the end of the heating season and prepares for upcoming warmer months. This period is marked by increased investor confidence as the company transitions into the next quarter.

The mid-May to the end of May period continues this bullish trend, supported by seasonal demand fluctuations and strategic positioning in the market. As the company prepares for the summer months, investor optimism is generally reflected in the stock’s performance.

Mid-October to the end of November represents SR's strongest bullish phase. This period aligns with the onset of colder weather, which increases demand for heating, and is often accompanied by strong earnings reports that bolster investor sentiment.

On the bearish side, SR tends to experience pullbacks from the end of July to early August (summer) and from the end of August to early September (late summer). These bearish trends may result from seasonal slowdowns in energy demand during the warmer months when heating requirements are low.

In summary, Spire Inc. tends to perform well in late March to mid-April, mid-May to the end of May, and especially from mid-October to the end of November. However, investors should be cautious of potential bearish pullbacks from late July to early August and from late August to early September.


SR Seasonality Chart


Saturday, 16 November 2024

SCI Seasonality Chart

 Service Corporation International (SCI) - Seasonal Performance Overview


Service Corporation International (SCI) exhibits notable seasonal trends that can guide investment strategies. Historically, SCI shows a bullish tendency from mid-February, lasting about a week, followed by a stronger bullish phase from late March to the end of May (spring), another from July to mid-August (summer), and a final bullish period from late November to early December (late autumn to early winter).

The mid-February rally is often driven by strong early-year performance, but it is typically followed by a correction leading into March. This correction phase may reflect a temporary market adjustment as the initial momentum fades. Late March through May is a more sustained bullish period, likely influenced by favorable earnings reports and strategic business activities in the spring.

July to mid-August continues this positive trend, aligning with summer financial results and investor optimism. However, this is usually followed by a short pullback from mid-August to the end of the month, as markets digest mid-year performance data.

Finally, the late November to early December period sees renewed bullish activity, often driven by year-end business strategies and holiday season factors.

In summary, SCI generally experiences strong performance in mid-February, late March to May, July to mid-August, and late November to early December. However, investors should be mindful of potential corrections after mid-February and the brief pullback in late August.


SCI Seasonality Chart


Friday, 15 November 2024

LDOS Seasonality Chart

 Leidos Holdings, Inc. (LDOS) - Seasonal Performance Overview


Leidos Holdings, Inc. (LDOS) displays distinct seasonal trends that can inform investment strategies. Historically, LDOS shows bullish tendencies in February (winter), mid-May (spring), mid-July (summer), and from the end of October to November (autumn). Conversely, the stock tends to be bearish in late February (winter to spring), May (spring), and June (summer).

In February, Leidos often benefits from the momentum of year-end contracts and positive fiscal reports, driving investor confidence during the winter season. Mid-May marks another bullish phase, likely due to increased government contracts and spending cycles typical in the spring.

Mid-July sees bullish activity as summer contracts and mid-year financial reviews boost the stock’s performance. From the end of October to November, LDOS typically performs well, driven by year-end contract renewals and government spending before the fiscal year ends.

On the bearish side, late February can be challenging as the post-winter slow-down begins, affecting stock performance. May and June also tend to be bearish, possibly due to lower spending and fewer contract announcements during these months.

In summary, Leidos Holdings generally performs well in February, mid-May, mid-July, and from the end of October to November. Investors should focus on these bullish periods while being cautious during the bearish phases in late February, May, and June.


LDOS Seasonality Chart


Thursday, 14 November 2024

YUM Seasonality Chart


Yum! Brands, Inc. (YUM) - Seasonal Performance Overview


Yum! Brands, Inc. (YUM) shows clear seasonal trends useful for investment strategies. Historically, YUM tends to be bullish from mid-March to the end of April (spring), late May to early June (spring to summer), October (autumn), and from mid-November to early December (late autumn to early winter). Conversely, the stock often experiences bearish phases in June (summer) and from the third week of September to the end of September (early autumn).

In mid-March to late April, Yum! Brands benefits from spring promotions and increased consumer spending. Late May to early June sees a boost from summer transitions and seasonal marketing. October continues this trend with fall promotions and heightened consumer activity.

From mid-November to early December, Yum! Brands capitalizes on holiday dining and promotions, leading to strong financial performance.

Bearish trends are evident in June, with seasonal dips in consumer spending, and from the third week of September to the end of September, due to reduced activity before the holiday season.

In summary, Yum! Brands performs well from mid-March to late April, late May to early June, October, and mid-November to early December. Investors should focus on these bullish periods and be cautious during the bearish phases in June and late September.


YUM Seasonality Chart


Wednesday, 13 November 2024

AAPL Seasonality Trend


Apple Inc. (AAPL) - Seasonal Trend Overview


Apple Inc. (AAPL) exhibits distinct seasonal trends that can be instrumental for investors seeking to optimize their strategies. Historically, AAPL has demonstrated bullish tendencies from July to August, in mid-October, and mid-November.

The bullish period from July to August, occurring during the heart of summer, often aligns with an uptick in consumer anticipation for Apple's upcoming product launches, typically announced in early fall. This anticipation drives investor optimism and often leads to positive momentum in AAPL’s stock as the market looks forward to the latest innovations from Apple. The summer season, with its longer days and higher consumer activity, typically supports this bullish trend.

Mid-October, firmly within the fall season, represents another significant bullish phase for AAPL. This period often coincides with the official launch of new iPhone models and other Apple products, generating a surge in consumer demand and media attention. The excitement surrounding these launches, coupled with strong pre-order numbers, generally results in a boost in AAPL’s stock performance during this time.

Mid-November, as fall transitions into early winter, is marked by another bullish period for AAPL. With the holiday shopping season approaching, demand for Apple products typically rises as consumers start purchasing gifts, particularly high-ticket items like iPhones, iPads, and MacBooks. This seasonal surge in sales, driven by holiday shopping and year-end promotions, usually contributes to strong financial performance and further supports positive momentum in AAPL’s stock.

In summary, Apple Inc. generally performs well from July to August, in mid-October, and mid-November. These periods are characterized by heightened consumer interest and strategic product launches, making them key times for potential gains in AAPL’s stock performance.


AAPL Seasonality Chart


Tuesday, 12 November 2024

IBM Seasonality Chart


International Business Machines Corporation (IBM) - Seasonal Trend Overview


International Business Machines Corporation (IBM) showcases distinct seasonal stock trends that can be valuable for investors aiming to fine-tune their stock strategies. Historically, IBM stocks tend to display a bullish tendency in February, late March, July, and from late October through December. On the flip side, bearish trends are commonly observed in mid-April, mid-June, and mid-October.

The bullish period in February often coincides with the transition from winter to early spring, a time when investor optimism begins to rise after the new year. This period frequently sees stronger performance in IBM stocks, with increased market activity driving positive momentum.

Late March, during the middle of spring, marks another favorable time for IBM stocks. This is typically a period of economic growth, where corporate earnings expectations rise, contributing to a steady bullish trend. July, situated in the heart of summer, also tends to bring favorable market conditions for IBM, supported by ongoing mid-year business evaluations and strong investor sentiment.

From late October to December, as autumn transitions into winter, IBM stocks generally enter another bullish phase. This period aligns with end-of-year market dynamics, including increased trading volumes and strategic portfolio adjustments, which help push IBM stocks higher during the close of the calendar year.

On the bearish side, mid-April, at the peak of spring, can present challenges for IBM stocks. This is a time when market volatility may rise, and investors often reassess their portfolios, leading to weaker stock performance. Similarly, mid-June, early in the summer season, is another period where IBM stocks might face bearish pressure, possibly due to reduced trading activity and summer market slowdowns. Lastly, mid-October, as fall progresses, represents a potential bearish phase where caution prevails among investors as they prepare for the year-end.

In summary, IBM stocks show strong bullish tendencies in February, late March, July, and from late October through December, capitalizing on seasonal shifts and investor enthusiasm. However, investors should be aware of bearish trends in mid-April, mid-June, and mid-October, as these periods tend to bring challenges to IBM's stock performance.

IBM Seasonality Chart


Popular Posts

Blog Posting